Smarter Operations with AI: Detecting Fraud and Boosting User Engagement
Introduction
According to a 2020 report, 94% of enterprises believe that data will be important to their growth [1]. Despite this, 63% of companies claim to be unable to gather insights from their big data [2]. With more and more companies turning to data to augment their business, it is becoming increasingly important for companies to utilize artificial intelligence and machine learning to stay competitive. Machine learning (ML) is a field within artificial intelligence that makes use of data in order to make predictions or decisions.
Machine learning models are essentially advanced functions that can be discovered from data. They take input data, perform operations on that data, and output a result. In the case of using AI for business insights, this input data can be anything that is relevant to business operations, such as sales figures, user behavior, or marketing efforts. The result is then something you would want to predict from this data, such as future sales, probability of churn, or ad campaign success. Machine learning models learn what to output by looking at many examples in a dataset and updating the operations they perform in order to get their output to match known target values. A trained model can then be used on data it hasn’t seen to predict unknown target values.
Training a machine learning model is an investment from a business perspective. First one has to collect a large enough dataset and ensure that the data points in it have the labels the model needs to predict the correct output. Then the right kind of model for the task must be selected. The right kind of model depends on the structure of the data and task to be performed. Once a model is trained, it must be evaluated to ensure that it performs well on the task it was trained to do. All of this takes a considerable amount of engineering effort from a machine learning engineer. In this blog post, we will demonstrate how models can be used in multiple ways in order to achieve a greater return on all that initial engineering investment.
Case study
In 2022, we worked to enable ML-powered, data-driven workflows at On Device Research. On Device Research is a UK-based company that aids brands in conducting market research through their survey platform, Curious Cat. On the platform, users receive a payout for completing surveys from various buyers. A buyer may reject completed surveys that do not satisfy their quality control requirements. In order to ensure that surveys are more accurately matched to users, with a minimized chance of being rejected, we have employed a couple of machine learning models. We also show how a machine learning model trained for a given task can be reused for other purposes.
Classifier for Probability of Rejection
A classifier is a type of ML model whose purpose is to label data points as belonging to one of several groups, called classes. In this use case we built a binary classifier, or one that classifies inputs into one of two classes, namely “rejected” or “accepted”. If we can make an accurate prediction of whether a user’s response will be rejected, we can avoid serving the user that survey in the first place. This minimizes the costs associated with rejected responses and enhances user experience. This is an example of using a model directly for the task it was trained for.
The classifier uses a set of features to make classifications. A feature is a field of information that the model uses as an input to perform its task. By finding patterns in the features, the model learns to associate different configurations of feature values with the classes of interest.
After training, feature importance plots and Shapley values can be used to get a better understanding of the interaction of features and how they affected model predictions. More information about Shapley values can be found in Explainable AI in medicine: Detecting AF in ECG data.
One useful way of creating additional model features is to aggregate over fields. The code snippet below shows an example of how SQL “with” clauses can be used to define subqueries to perform aggregations. The aggregations are done over a 3-day rolling window, excluding the current row from the calculations. This is done by defining the window as an interval between 2 days (172800 seconds) preceding and 1 second preceding the current row. We do not want to include the current row in the aggregations since it contains information about the current data point which will not be available at the time of scoring. When information that would not be available when the model is used in production is used during training, this is called a target leak. It is important to avoid target leaks when training a model as it gives a falsely inflated estimate of the model’s actual performance.
WITH sc_aggregated_features AS (
  SELECT
    COUNT(sc.feature_1) OVER (
      PARTITION BY
        sc.user_id
      ORDER BY
        sc.feature_1
      RANGE BETWEEN INTERVAL '172800' SECOND
      PRECEDING AND INTERVAL '1' SECOND PRECEDING
    ) AS feature_1_count_last_3_days,
    COUNT(sc.feature_2) OVER (
      PARTITION BY
        sc.user_id
      ORDER BY
        sc.feature_2
      RANGE BETWEEN INTERVAL '172800' SECOND
      PRECEDING AND INTERVAL '1' SECOND PRECEDING
    ) AS feature_2_count_last_3_days
  FROM
    survey_completes AS sc
  ORDER BY
    sc.user_id,
    sc.date
)
SELECT
  af.feature_1_count_last_3_days,
  af.feature_2_count_last_3_days,
  (
    af.feature_1_count_last_3_days -
    af.feature_2_count_last_3_days
  ) AS feature_3_count_last_3_days
FROM
  sc_aggregated_features AS af
Classifier for Fraud Detection
Although a classifier is generally used to predict a class, it is possible to get the probabilities that an input belongs to a given class from the model. We can make use of these probabilities to gain further insights. While there is always some baseline number of fraudulent users, sometimes there are large coordinated attacks where malicious actors employ bots or emulators to submit a large number of fraudulent surveys. By examining how high the rejection probabilities are over a given period of time, we can detect when there is increased traffic of potentially fraudulent behavior. Knowing that we have entered into a regime of high fraud can be used to protect the business and help take vital and informed business decisions.
The image below shows the rejection (or bad) rate per day. It shows two significant spikes of increased fraudulent user behavior. A threshold is used to set the confidence level of whether a prediction should be considered bad or not. The plot below shows an illustration of how the rejection model can be used to protect a business, by significantly reducing the spike of fraudulent user behavior, while at the same time not affecting periods of more normal user behavior too much.

Learn to Rank Model for Recommendation System
Numerous algorithms can be used for recommendation systems but the objective remains the same: suggest the most relevant items to a user. In this project, we posed the recommendations as a ranking problem. The objective of a ranking algorithm is to rank a list of items from most relevant to least relevant with respect to labels, based on a set of features. In this context, the relevance of a survey for a particular user was determined by whether or not the user had completed the survey.
The model was trained on historic data of millions of survey attempts from tens of thousands of users. If a survey was completed it was labeled as relevant to that user, otherwise, it was labeled as irrelevant. The trained model takes user data and a list of potential surveys as input and outputs a sorted ranked list according to survey relevance for that given user. The model was evaluated on how well it could produce k recommendations, where k is an integer, using mean average precision (MAP@k).

The figure below shows the MAP scores for four different values of k for one of the models we built. The same metric was then calculated, but using randomly scrambled targets, to get a better understanding of the gain in using the recommendation system compared to presenting surveys at random.

Recommendation System
The recommendation system built into the project consisted of three steps:
- Filter potential surveys based on user profile and target user profile of the survey
- Produce a ranked list of the relevant surveys for a given user using the learn-to-rank model
- Calculate the probability of a survey answer being rejected using the classifier. This probability can then be used to evaluate the risk of serving this particular user this particular survey.
By presenting users with surveys they are more likely to complete, they are more likely to have a better user experience, more likely to complete more surveys, and more likely to return at a later time. By removing tasks for users which are likely to get rejected, we can minimize the costs associated with rejected responses.
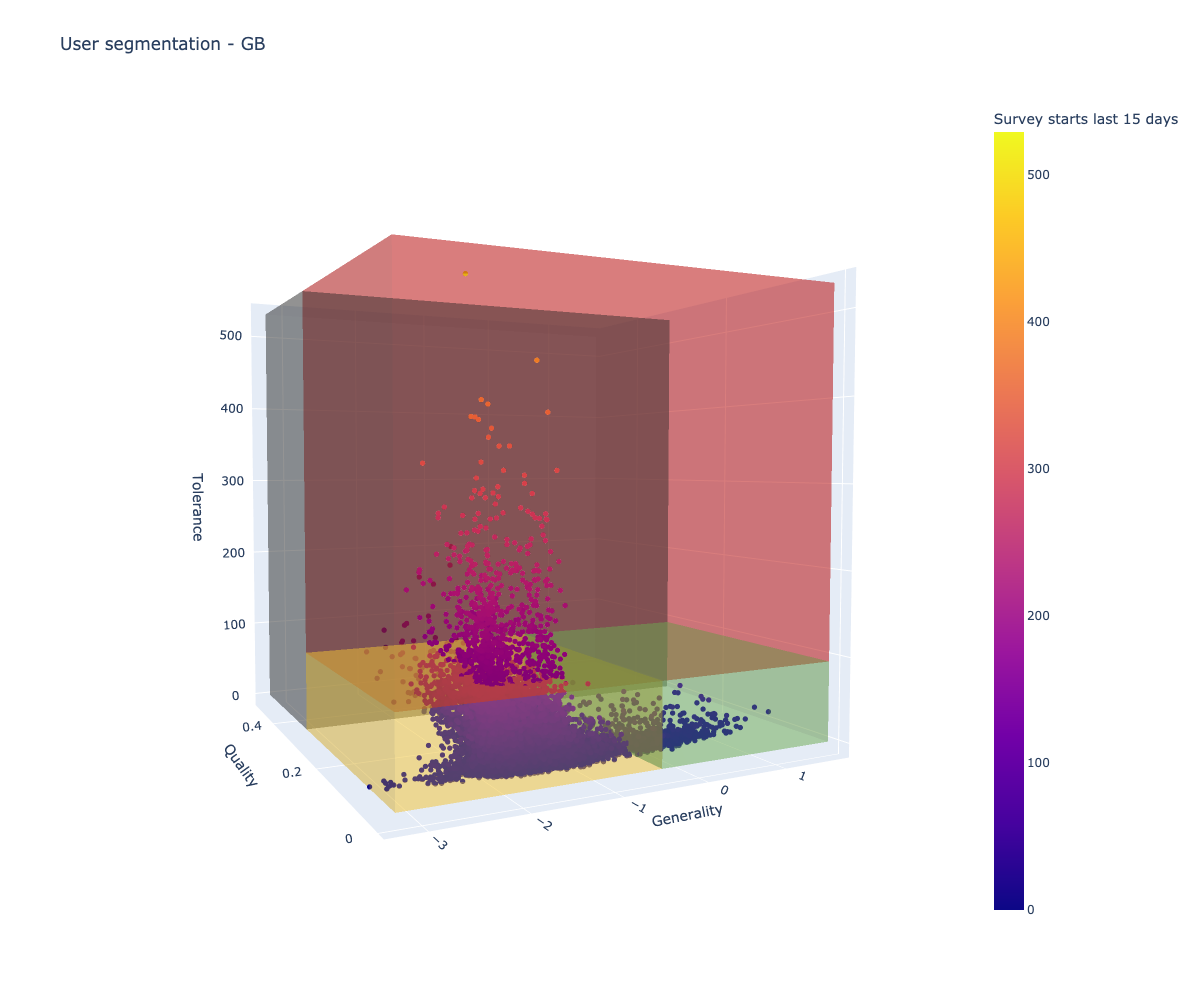
Using Model Predictions for User Segmentation
In order to segment users, we determined three characteristic features relevant to how they interact with the service; Generality, Quality, and Tolerance. We took advantage of the two previously trained models to generate estimates for these characteristics.
- Generality: measures how diverse the set of surveys suitable to the user are – we can use the outputs of the learn-to-rank system to get a measure of generality
- Quality: measures how likely a user is to complete surveys that will not be rejected – we can use the rejection probabilities from the classifier to get a measure of quality
- Tolerance: measures how likely a user is to return to complete more surveys – we can use aggregated user features to get a measure of tolerance
By plotting these three characteristics, we can get an idea of how the population of users is distributed in the space. Segmenting this space into different regions allows users to be treated in a way that best optimizes their personal experience with the app. For instance, users with a high tolerance and high generality can be shown many diverse tasks, while users with low tolerance and low generality can be served a small set of highly relevant tasks without overwhelming them with options.

The distribution of the survey population can be plotted in a similar manner, although only looking at generality and quality since tolerance is not defined in the context of surveys. By identifying which segment a user and survey belong to, a business can e.g. apply different strategies to handle the different segments, as described above.
Summary
Even though machine learning models have clear objectives, their outputs can be used in several different contexts. By applying models to multiple systems and analyzing the outputs, a business can maximize their returns on machine learning investments.
This blog post highlights how the rejection and ranking models built for On Device Research in 2022 were used not only for their direct outputs but also for the detection of spikes of fraudulent behavior, as primary components of a recommendation system, and to define user and survey segments.
References
[2] https://www.sigmacomputing.com/surveys-reports/data-language-barrier