
Redefining the Future of Build-to-Rent with Catella
Introduction
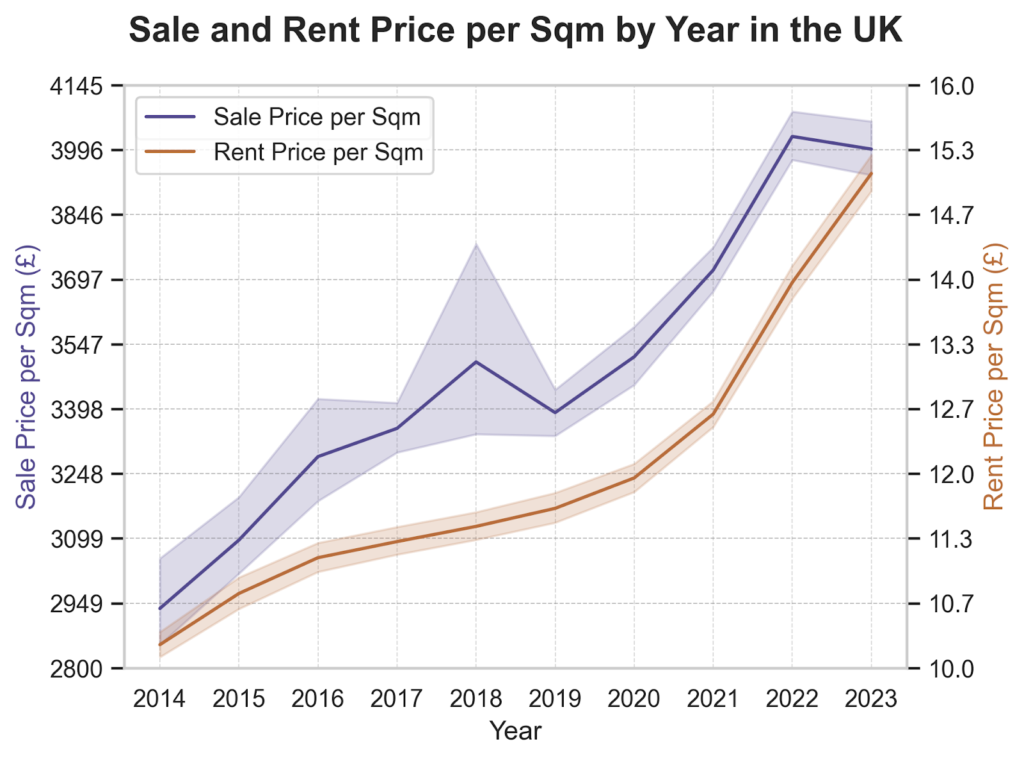
The concept of Build-to-Rent (BTR) is emerging worldwide as a solution for housing shortage. Simply put, BTR developments are properties constructed to be rented out, not sold. These initiatives not only provide high-quality living spaces, but also promise investors reliable long-term returns. BTR stands out as a resilient investment, especially in times of economic uncertainty, as the ongoing demand for housing ensures sustainable rental yields despite potential fluctuations in property values (Figure 1).
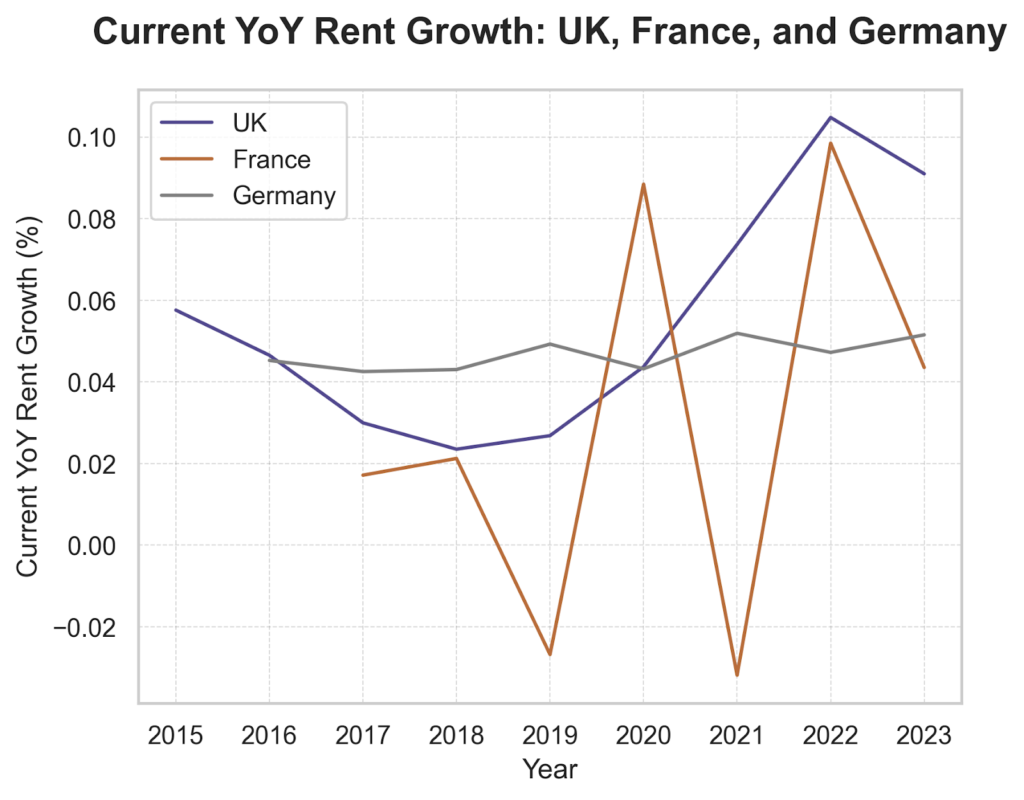
Optimizing BTR investments requires pinpointing locations with significant potential for rental price growth. However, the rental market’s swift evolution presents a challenging situation (Figure 2), which is where the advances of artificial intelligence (AI) offer promising solutions. AI’s ability to automate and refine manual processes can significantly improve decision-making precision and bring greater flexibility into real estate operations.
To navigate the future of BTR, we collaborate with Catella, a leading entity in property investments and fund management across Europe with a strong emphasis on data-driven strategies. Together, we leverage machine learning (ML) models to conduct a forward-looking analysis, using historical rent data as a foundation.
Our objective is to capture the subtle dynamics of rental markets in different countries, employing these models to identify ideal locations for BTR developments by accounting for each country’s unique characteristics. To achieve this, we integrate ML with insights from local experts across Europe, ensuring our models are not just data-centric but also informed by market specifics. Through this collaborative pan-European effort, we have developed predictive models in three key markets – the UK, Germany and France.
In this blog post, we will explore the technical backbone of our BTR initiative, explaining the key steps we have taken to employ ML in our analysis. We will also present our case studies to illustrate our approach in action, including an interactive web app designed for streamlined location screening, and a comprehensive portfolio analysis aimed for accessing past performance.
AI in BTR: A Brief Overview
The model draws from a wide range of datasets, including rental histories, ESG (Environmental, Social, and Governance) factors, neighborhood metadata, demographic details, economic indicators and commune patterns, etc. This comprehensive data compilation allows new properties to “learn” from the experiences of other areas and neighborhoods that have shown similar characteristics historically. By doing so, it positions new BTR projects to benefit from proven strategies and insights drawn from similar environments while predicting future trends.
Technical solution: from data to decisions
Data collection
The cost of rent is influenced by a variety of factors. This includes the physical attributes of the property – such as its size, the number of bedrooms and bathrooms, and its furnishing status – alongside a range of external factors. For example, rent prices are also shaped by broader economic conditions, accessibility to transportation and commuting durations. To capture these diverse influences, we’ve initiated a comprehensive data collection effort. This includes, but not limited to, compiling rental listing data, deriving economic insights from leading economic research institutions, and extracting geographical and commuting data from mapping services.
In addition to conventional data sources, we have also explored non-traditional factors such as land use patterns (i.e., how land is utilized within a neighborhood) and the density of railway connections in an area. This way, we are able to factor in aspects traditionally neglected, enabling a multidimensional framework for analysis, providing our ML model with a competitive edge.
Geospatial data integration
In our collaboration with Catella, we’ve identified a level of geographic precision that mirrors the granularity of postcode areas. This granularity is selected for its effectiveness in delivering insights that are both actionable and relevant in BTR developments.
With this geographic granularity established, we proceed to aggregate rental listing data within these defined areas. This involves gathering and compiling property listings that accurately capture the distinct characteristics of each segment. Following this, we integrate these detailed property listings with the broader datasets assembled during our initial data collection phase.
The next steps include carefully selecting key features to focus, crafting new features from the raw data and thorough data cleaning, ensuring a comprehensive understanding of the rental landscape.
Model training
Moving forward, we enter the model training phase, an essential stage where we train our model to predict rental growth in target areas for the next five years. By treating time series data as individual, separate observations within our regression analysis, we can pinpoint areas with substantial growth potential.
Our approach includes advanced techniques that enhance our model performance. While we value the contribution of these techniques, we maintain the confidentiality of specific methodologies to preserve our strategic advantage.
Model explainability
Understanding the rationale behind our model’s predictions is crucial. To achieve this, we employ model explainability techniques.
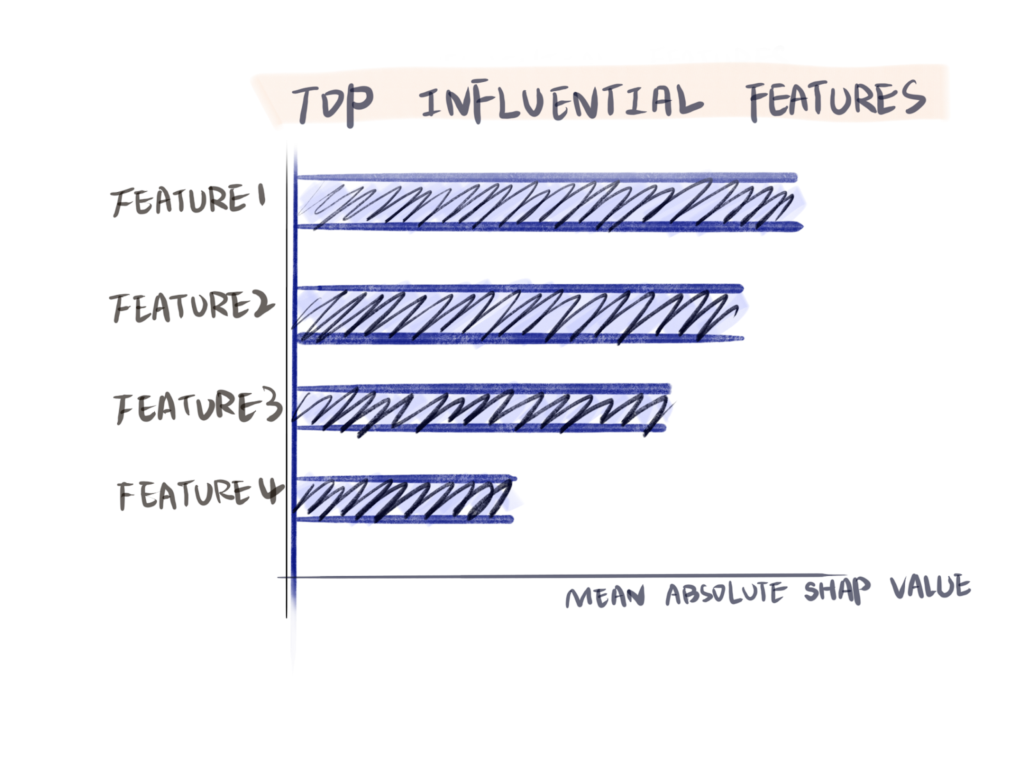
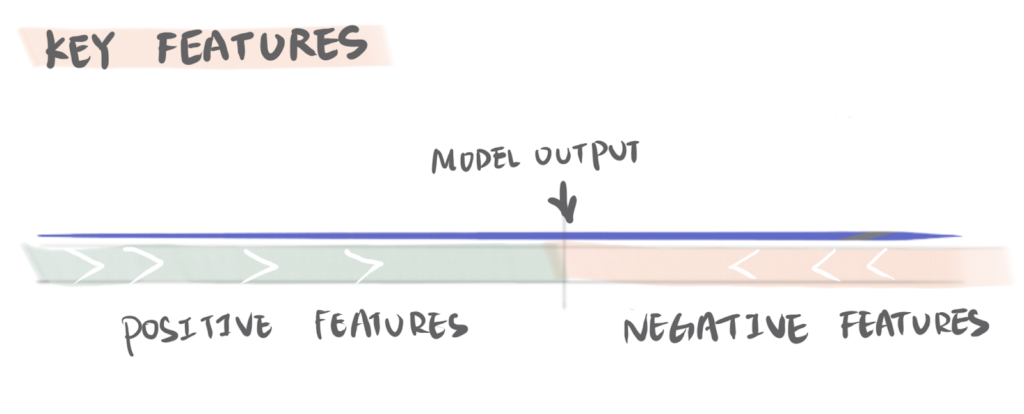
Specifically, we utilize SHAP (SHapley Additive exPlanations) summary plots to provide a global view of the impact of each feature across all predictions (Figure 3).
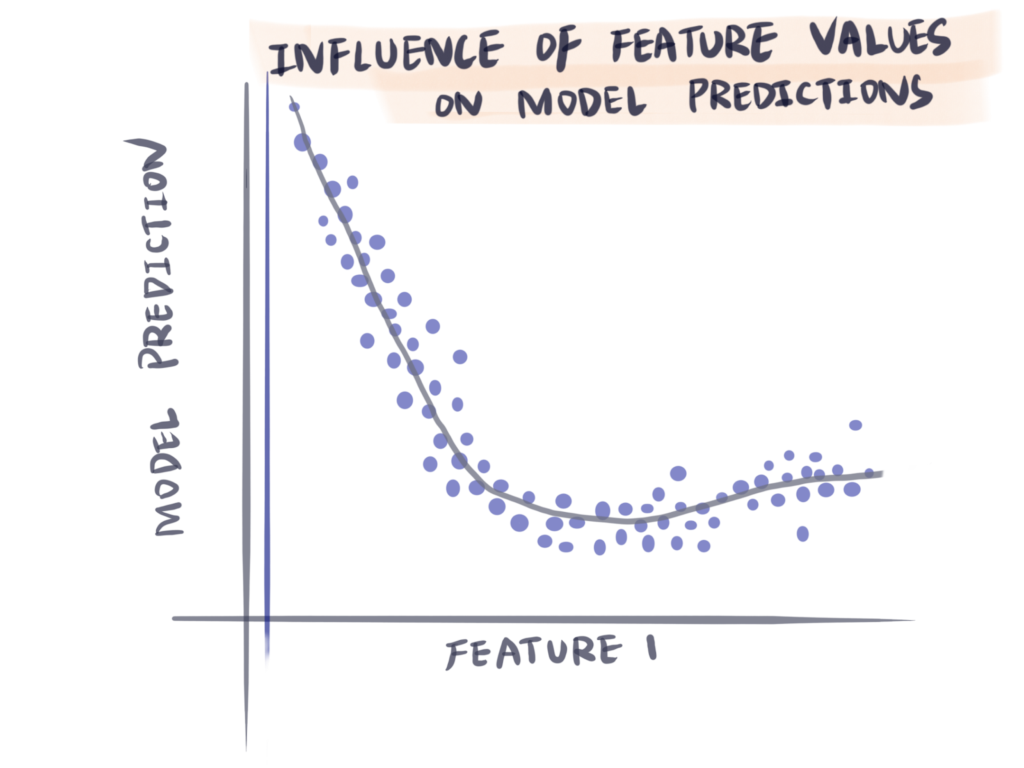
Meanwhile, dependency plots offer a detailed look at how changing a specific feature’s value affects rental growth predictions, including the exploration of nonlinear dependencies and the interaction effects with other features (Figure 4).
Additionally, to understand the influence of features on predictions for individual locations, we break down the prediction into contributions from each feature for a single prediction, allowing us to visualize and interpret the model’s behavior on a micro scale (Figure 5).
Through the application of these explainability tools, we can unveil the model’s reasoning, which reinforces confidence in the insights and strategies derived from our model’s predictions.
Case study 1 – interactive web app for location screening
Our technical solution’s real-word effectiveness is showcased through an interactive web application designed for location screening (Figure 6). This app not only enables users to access locations for a tailored analysis that presents anticipated rental growth over the next five years, but also integrates multiple model explainability plots discussed above.
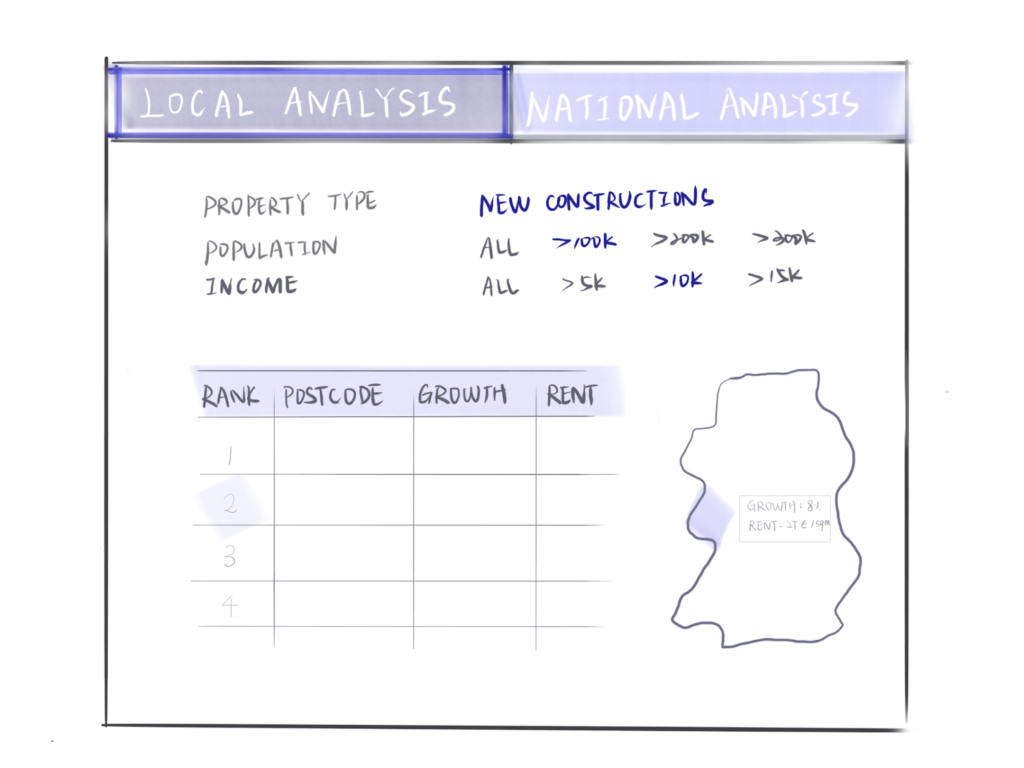
For any chosen location, users can investigate the essential factors influencing the forecast, either confirming or questioning current market assumptions. Additionally, the app provides insights on the rationale behind model predictions on a national scale, highlighting key drivers across various locations and encouraging strategic learning.
This process incorporates a feedback loop through ongoing interaction with Catella’s investment research team, ensuring the app’s features are aligned with their analytical needs. This not only enhances the application’s utility but also facilitates a collaborative effort to identify and implement potential improvements.
Case study 2 – portfolio analysis for evaluating past performance
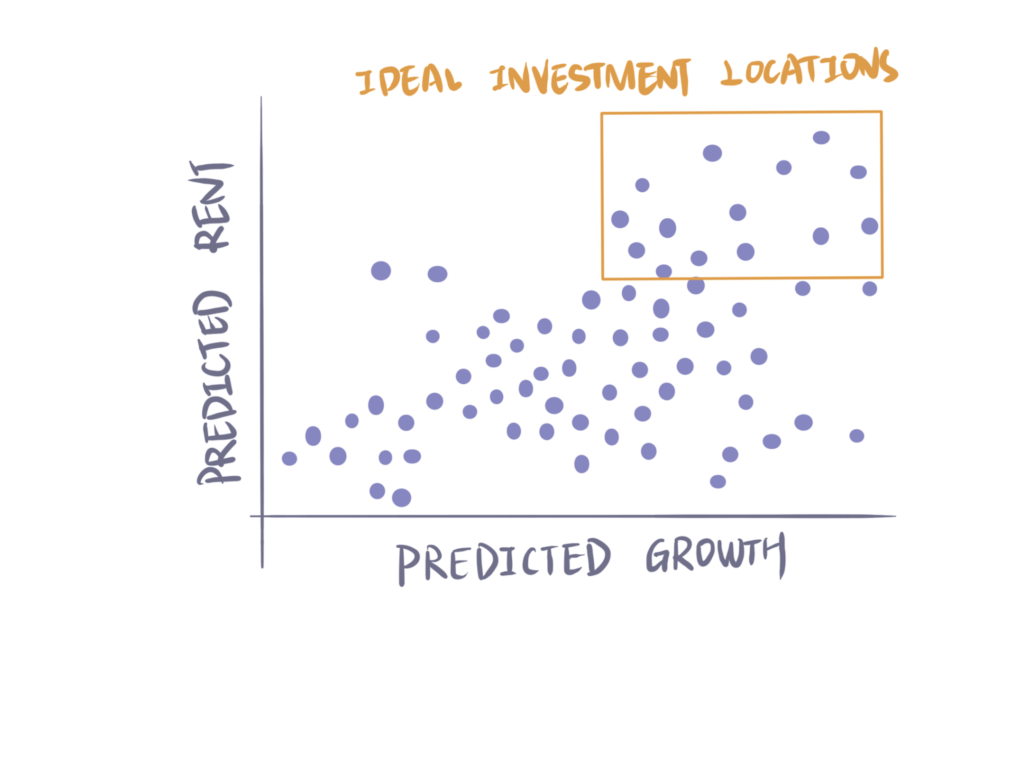
In addition to location screening, evaluating the performance of portfolio assets against similar areas – those sharing similar demographics, income levels and proximity to major cities – is crucial. Access to a model that forecasts future rent and growth allows for such an assessment of past investment effectiveness, providing valuable insights into potential risks and future returns (Figure 7).
Wrapping up
The integration of ML models in the BTR sector enhances our ability to pinpoint and leverage opportunities for rent growth. By utilizing comprehensive datasets, refined model techniques and forward-thinking strategies, we are setting new benchmarks for uncovering investment opportunities.
Looking forward, we aim to continuously innovate and adapt our models to meet the evolving demands of the market. This includes expanding our reach into new markets, updating our algorithms with the latest market trends, and integrating real-time data to maintain a competitive edge.